
 |
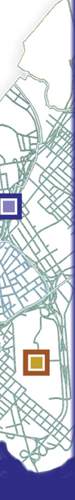
How GIS Is Used in Law Enforcement GIS does not replace a law enforcement agency’s process of collecting and storing information in a database. Rather, it enhances the agency’s ability to use the data. However, the use of contextualization raises new concerns about the need for privacy and confidentiality guidelines. For example, a map can be created to show when and where a crime occurred with what type of weapon was used, whether a victim was present, whether the victim was male or female, and so forth. Once data, such as the income level of Hispanic females between ages 18 and 25, is entered into a GIS database, the user can overlay that information with a specific crime, such as recent homicides or rapes occurring in the neighborhood between 8 p.m. and midnight. Overlaying specific crimes with ethnicity, age, and gender may inadvertently reveal the identity of a victim. Therefore, the creators of GIS data layers must be aware of confidential and sensitive data and the need to take precautions to protect victims’ rights and privacy.GIS usage enhances a police officer’s time on the streets. An officer with access to GIS software and additional datasets, such as parolee and probationer data, can run queries from a laptop in the patrol car using the Community Policing Beat Book. The Community Policing Beat Book is a crime-mapping tool created by Environmental Systems Research Institute (ESRI), funded by NIJ,11 and tailored for law enforcement agencies. Officers can use it to check how many parolees or probationers were recently released on their beat, the conditions of their release, and if they have violated any of these conditions. In addition to plotting the geographical attributes of criminal phenomena, law enforcement agencies seek answers to why a specific crime occurs in a certain area. In 1982, George L. Kelling and James Q. Wilson developed the Broken Windows theory to describe the relationship between disorder and crime in a neighborhood. They concluded that as the physical environment in a neighborhood deteriorates the crime rate increases. Newly opened adult bookstores selling pornographic materials, check cashing stores, and vacant housing are predictors of declining neighborhoods. By highlighting aspects of a crime on a map with neighborhood attributes, crime analysts can contextualize the data and gain insight about why crimes occur. Some law enforcement agencies use crime mapping to show where registered child sex offenders live. They compare the locations of child sex offenders with the locations of the town’s schools. A buffer zone is drawn around each school to observe how close the known offenders live to these potential target areas. The sheriff’s department in San Bernardino County, California, is one agency that uses this technique. Exhibit 8 shows how the Redding Police Department in Redding, California, uses this technique to map registered child sex offenders. One department goal is to register sex offenders with local law enforcement, a requirement under Section 290 of the California Penal Code. Another goal has been to arrest individuals who have violated the conditions of their parole or probation. In 1999, 3 of 36 targeted registrants were arrested for noncompliance with the penal code or some violation of parole or probation. In addition, county officers issued warrants for 25 other registrants. For more details, check out Crime Mapping Case Studies: Successes in the Field, Volume 2 (La Vigne and Wartell, 2000). Similarly, a victim service provider could use GIS to track and map the location of both offenders and/or victims who were issued protection orders in stalking cases. GIS software can map the home address of an individual, taking into consideration the conditions of the protection order associated with the offender. Distance buffers can then be drawn around these locations and reveal violations or compliance with the specified restrictions.
|
|||||||